-
-


-
Wall Color
in
Uncheck to hide the white line Check to show the white line -
-
.


Frame
Room
Gallery
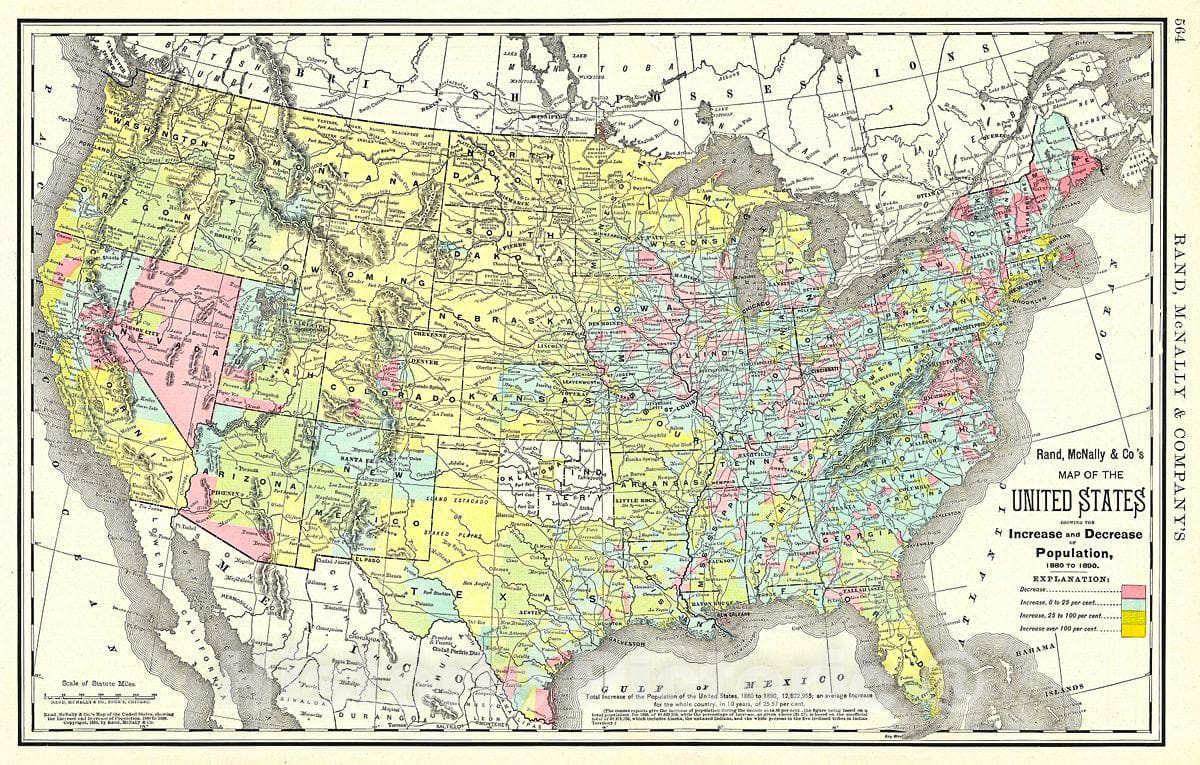
Historic Map : Rand McNally Antique Map of The United States Showing Change in Population, 1892, Vintage Wall Art
Historic Map : Rand McNally Antique Map of The United States Showing Change in Population, 1892, Vintage Wall Art
Note: Sold out or unavailable
Couldn't load pickup availability
An attractive 1892 Rand McNally and Company map of the United States, showing the increase and decrease of population from 1880 to 1890. Divided by color coding into four degrees ranging from decrease to increase over 100 percent, the map notes an average increase in population of 25.57 percent in ten years. Throughout rivers, towns, cities, mountains, railroads, and other topographical features are noted with elevation rendered by hachures. This map was issued as plate no. 564 in the 1893 edition of Rand McNally and Company's Indexed Atlas of the World- possibly the finest atlas Rand McNally ever issued.
- MUSEUM QUALITY INKS AND PAPER: Printed on thick 192gsm heavyweight matte paper with archival giclee inks, this historic fine art will decorate your wall for years to come.
- VINTAGE MAP REPRODUCTION: Add style to any room's decor with this beautiful print. Whether your interior design is modern or classic, a map is never out of fashion.
- ATTENTION TO DETAIL: We edit every antique map for image quality, color and vibrance, so it can look its best while retaining historical character. Makes a great gift!
- FRAME READY: Your unframed poster will arrive crease-free, rolled in a sturdy mailing tube. Many maps fit easy-to-find standard size frames 16x20, 16x24, 18x24, 24x30, 24x36, saving on custom framing.
- Watermarks will not appear in the printed picture. Some blemishes, tears, or stamps may be removed from the final print.
What our customers are saying
★★★★★I purchased an historic map, 16x24 inch. It is beautifully printed on heavy stock. The lettering, colors, and details of the map are crisp and easy to read. I am highly satisfied and would certainly purchase from Historic Pictoric again!
Kent A.
★★★★★Ordered the Pan American Midway print to fit a lovely thrift-store gilded frame. I love showing off Buffalo's rich history and this is a pretty entertaining photo from 1901. Prompt shipping. Sturdy packaging.
Cindy O.
★★★★★I received my print within days of ordering, and it arrived well packed in a mailing tube. The print is high quality and exactly as advertised. I will use Historic Pictoric again in the future!
Cheryl H.
★★★★★Excellent product. Great fidelity in reproduction of the original. Fine/minute details were sharp, colors were vibrant, and thickness, texture and overall feel and quality of the paper were excellent. Very satisfied with my purchase.
Konrad B.
★★★★★I have purchased six maps from Historic Pictoric. I find the quality to be excellent. Their customers service is also excellent. Outstanding! I called to exchange a few for different sizes and I could not have asked for a better experience.
Aaron C.
★★★★★The original map I ordered lacked some of the detail that I had hoped for, but they responded with several more map possibilities to choose from. Excellent service- a far step beyond what anyone expects from online purchases.
Dan M.
★★★★★I am a owner of 5 maps from Historic Pictoric. From Okinawa, 1945, Europe 1940-1945 battle maps. Now they’re helping me with the battle of Gettysburg. These maps are so much superior to the map on a page in a book. I have framed two of them.
Steven Ko
★★★★★Great heavy paper quality and clarity of my nautical map. Will be a great addition to our home close to the beach!
Jennifer A